Opinion
Steve Hanke is peddling disinformation on Zim inflation
THE advent of social media enhanced information dissemination to dizzy heights, so much that one can literally communicate with the whole world at the click of a button. Needless to say such technological advancement needs to be used with responsibility.
Of late some academics decided to disinform the world on inflation rates being calculated in various countries, Zimbabwe included. Some media houses, activists and politicians, without checking validity and intentions of the source, jumped onto the bandwagon of condemning what is right and propelling unscientific calculations.
As usual, the loser is the general public who end up with the dilemma of whether to believe or not to believe. This problem necessitated this attempt to enlighten the public and take everyone back to where it all started.
Accounting for inflation has been around for more than three centuries. The early history of coming up with methods to calculate inflation evolved over a long period stretching from 1700 to 1879. (Robert O’Neil et al, The Origins of Measuring Inflation, 2017)
The French Revolution
The French Revolution had its fair share of commotion that brought about increases in the general price level, through supply side constraints. During this period, Government also introduced assignats (bills issued as currency by the French Government [1789-96] on the security of expropriated lands).
The inflationary period was characterised by a number of decrees postponing debts repayments, resulting in the decree of 13th July 1795 that temporarily suspended payments on all debts contracted before 1st January 1792. This was an appropriate move in response to creditors’ justified fear that assignats owed to them would continue to lose value (Eugene N. White, Measuring the French Revolution’s Inflation: the tableaux de depreciation, 1991).
Eugene N. White noted that by December 1795, protection for creditors was granted by Government allowing them to refuse repayment for contracts signed before 23rd September 1795, until a new law governing debts was enacted.
On 4 April 1796, the French government attempted a currency reform that phased out assignats and introduced mandats (bank notes issued as currency to replace assignats which had become virtually worthless). The government ordered all debts contracted in assignats prior to 1st January 1792 to all be repaid at face value in mandats. (Eugene N. White, 1991).
However, the government failed to maintain economic stability and finally acceded defeat on 23 July 1796, when it passed a new law that allowed citizens to freely set repayment terms. of any new contracts. Meanwhile, debtors and creditors continued to fight over how to settle repayments. Courts were then roped in to make solomonic judgements. In spite of this intervention, the newly introduced repayments regime remained divisive and chaotic. (Eugene N. White, 1991)
Eventually the government, through the law of 23 July 1797, ordered each department to draw up tables recording the declining values of assignats and mandates. The tables were to capture:
a) The price of coin; and
b) Free market values for:
i) Real estate;
ii) Foodstuffs; and
iii) Other 10 commodities.
Adjustments of the debt’s principal amount were to be made using the Tables of Depreciation that became widely used. Enterprising printers produced handbooks for businessmen containing such tables and explaining how they were to be used for purposes of calculating repayments. (Eugene N. White, 1991).
The above acts as one of the early methods and attempts at accounting for inflation.
Admittedly the tables had their technical challenges but they initiated one of the first important steps in accounting for loss of value of money.
Experiences of inflation in various parts of the world, over the years, led to improved techniques in accounting for inflation. This resulted in three major approaches, that give the following indices:
a) Laspeyres;
b) Paasche; and
c) Fisher.
Most countries the world over — Zimbabwe included — use the Laspeyres Price Index to measure inflation.
Membership of international organisations
The International Monetary Fund’s statistics division, World Bank, International Labour Organisation and other international bodies promote the development of internationally accepted statistical methodologies. These organisations foster availability of high-quality, consistent, and comparable macroeconomic and financial statistics.
They produce the Consumer Price Index Manual for the scientific production of statistics and offer advice, review missions and technical assistance to member countries.
Worth noting is that Zimbabwe and all member states have no option but to abide by the rules of the game when calculating inflation.
Enter Prof Hanke
Steve Hanke, a professor of applied economics at Johns Hopkins University in the United States, uses exchange rates and stock market indices to calculate inflation rates.
He bases his argument on the Purchasing Power Parity theorem. In Zimbabwe, he used the Old Mutual Implied Rate for a long time. This is besides the fact that stock market prices are driven by:
a)Fundamental factors and these have much to do with performance of firms;
b) Technical factors that are related to stock price history in the market;
c) Market sentiment – this is the most vexing and subjective category, where subjectivity comes into play; and
d) Speculative motive.
However, the goods and services market is not driven by the same factors as the stock market. Accounting for inflation involves tracking prices of commodities in the goods and services market. This is not the same as tracking price developments in the exchange and stock markets, thus Prof Hanke’s model and methods become questionable.
Of interest is that, in as far back as the 18th century the French in their wisdom could differentiate the stock, goods and foreign exchange markets. They respected the differences in these markets as well as the different factors that drive these three distinct markets. What is true is that the markets are not independent of each other as developments in one market can affect another. However, they were, are not and will never be substitutes.
Official versus parallel exchange rates
The principle used locally and internationally when collecting prices data is that enumerators collect prices that consumers would pay for goods or services. In cases where prices are quoted in foreign currency, enumerators are required to ask the shop personnel how much the commodity costs in local currency. Conversion is done by the shop-owner so that the enumerator captures the price that consumers would pay.
This principle also puts to rest the argument put forward by some, that ZimStat captures prices at official exchange rates only. Notable is that enumerators collect going prices in outlets, be they supermarkets, liquor shops, saloons, open markets and so on.
In short, ZimStat does not go about looking for exchange rates or cost build-ups as they are already factored in the final price.
ZimStat methodology
In undertaking the Consumer Price Survey (CPS), ZimStat uses purposive or judgmental sampling of outlets in both urban and rural areas. The sampling approach is the most recommended for such surveys and has the advantage that closed outlets and outlets that change their line of business are easily replaced.
Data collection
In compiling the Consumer Price Index, ZimStat monitors price levels of 495 products categorised according to United Nations Statistics Division’s Classification of Individual Consumption by Purpose (COICOP).
More than 4 000 retail outlets in both rural and urban areas are surveyed throughout the country every month. Data on prices is collected in the Consumer Price Survey around the 15th of every month. Among them are supermarkets, general dealers, departmental stores, liquor stores, open markets like Mbare farmers market, fuel service stations and garages, hotels and restaurants, fast foods outlets, bus and taxi companies, hair salons, pharmacies, communication service providers, government and private hospitals as well as rural and urban district councils.
Data processing and index calculation
The processing of CPS data is divided into several stages as indicated below.
Data consolidation
When data from the field is synced to the server, data consolidation takes place. Quality control is done by checking that all enumerators have submitted all data to the server and that data was collected within the stipulated period.
Checking of errors and inconsistencies
After data consolidation, each collected price is checked against the previous price. This process is done for all the thirty-five thousand price observations. Data is checked for errors and inconsistencies, which are then corrected.
Matching of price codes
After correcting errors and inconsistencies, the next step is to verify price codes for the 35 000 price observations. Each item for which prices are collected has a corresponding code. Missing items, special offer items and items with varieties that changed also have their respective codes. The idea of matching codes is to ensure that like is compared with like.
For example, a loaf of bread from company X in March 2021 cannot be compared with a loaf of bread from company Z in April 2021 within that same outlet, even if the quantity and price variations are the same.
This is because they are two different brands and cannot be compared. Prices of items on special offer cannot be compared with prices of items which are not on special offer. Likewise, the price of a 10kg and 20kg roller meal packet cannot be compared.
Only the same item varieties are compared and used to calculate price relatives between the two months.
Computation of the index
After matching the codes, price relatives are then calculated. These are calculated using the internationally recommended geometric mean method, as arithmetic mean tends to be more influenced by extreme values.
After calculating price relatives by province for the 495 items in the basket, elementary unweighted price indices are then computed using the Jevons formula, as opposed to other methods like Carli or Dutot which make use of arithmetic mean in their computation.
The All Items Index is computed using the arithmetic aggregation of 12 COICOP divisional indices and their respective weights which are shown below:
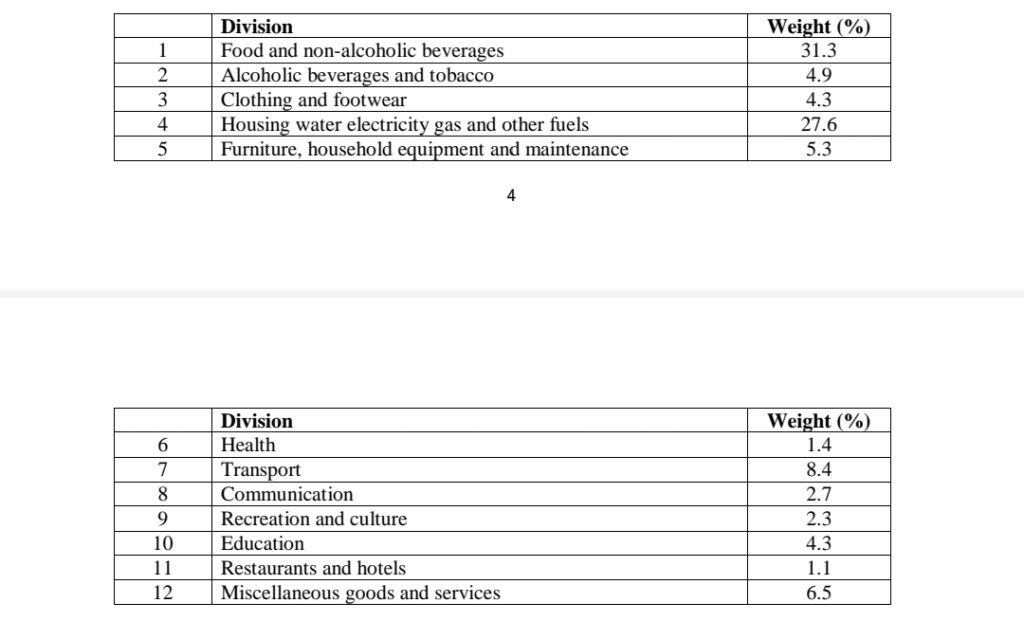
The above COICOP weights were derived from Household Budget Surveys undertaken once in every five years.
Enter the Second Republic
The coming in of a new government in Zimbabwe in 2017 saw Prof Hanke resorting to use of positive language. He would proffer his proposals on monetary sector reforms in a positive way.
It would appear Prof Hanke was looking for a few million-dollars-contract in exchange of consultancy work to stabilise the monetary side of the Zimbabwe economy. His tweets were telling in 2017, as he was not aggressive but showed interest. The professor was doing a combination of public relations and scouting for a consultancy contract.
He pursued this mirage for over twelve months. In the process he made sure he reminded everyone of his previous engagements with other Governments like Bulgaria. Interestingly, his prescription remained the same:
a) Dollarise; and
b) Establish a currency board.
By the last quarter of 2018 it then dawned on the professor that no contract was coming his way. This is when the animal in the professor took charge. Up to now he talks negatively of authorities in Zimbabwe with most being labelled incompetent. He pushed the agenda that wrong calculation of consumer price indices or suppression of inflation rates is synonymous with ZimStat.
A person outside any country cannot go through a systematic process of price data collection in retail outlets in a determined sample and apply the requisite processing techniques to come up with an inflation index. Authorities in Turkey have reminded the professor that there is no way he can calculate inflation in Turkey by use of exchange rate and stock market indices.
Interestingly, it is not ZimStat alone that is accused of all sorts of ills. The professor has a list of over 30 countries that are all alleged to be feeding stakeholders with wrong statistics.
Of interest is the way the professor presents his statistics, “Today, I measure inflation in #Turkey at a dismal 118%/year. My accurate measure is 1.5x TurkStat’s official inflation rate of 78,6% . . .” The same “accurate measure” concept is also applied to more than 30 other economies. In some cases, his accurate measure is 3.5 times the official statistics.
So the professor has issues with every other economy except the United States. Why? Because his model suddenly collapses as it is based on the exchange rate to the US dollar. So, when it comes to America there is no exchange rate to use in his model, leaving America out of the group of “problem” countries.
Hanke-Henry Permanent Calendar Hanke’s unique way of calculating inflation is not the only invention he has ushered to mankind. He once came up with a calendar reform proposal. With the professor’s calendar every calendar date would always fall on the same day of the week.
While the time and effort put in this calendar innovation is not public knowledge, the public is privileged to know the no traction, no takers result.
In conclusion, if Prof Steve Hanke was as right as he wants us to believe, then the IMF and other international institutions would have taken on board his methods.
About the writer: Taguma Mahonde is director-general of the Zimbabwe National
Statistical Agency (ZimStat).